
https://youtu.be/4DCww7jknok
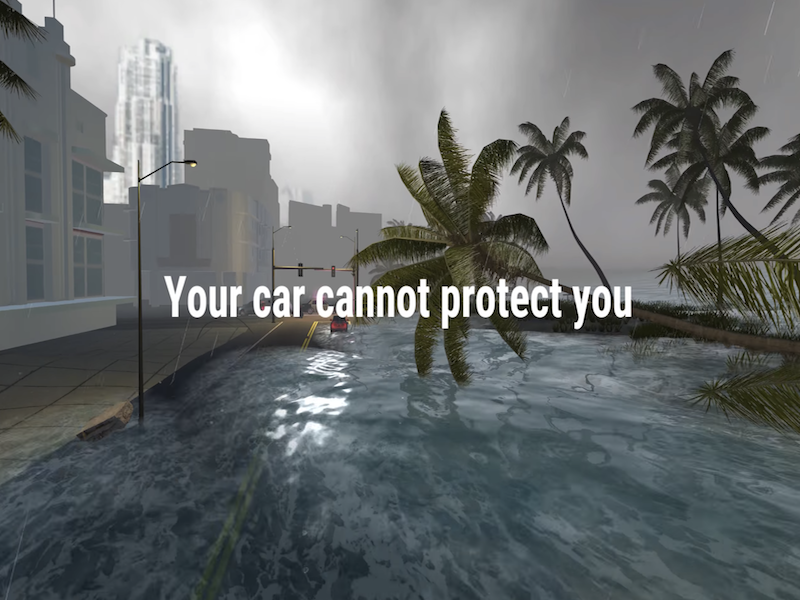
A storm surge occurs when winds, produced by a high-category hurricane, pushes water towards the land. Current systems usually rely upon 2D visuals when demonstrating the areas that may be affected or were already affected by a hurricane.
Distributed Multimedia and Information Systems (DMIS) lab, run by Dr. Shu-Ching Chen and a team of graduate and undergraduate students, developed a 3D Virtual Reality Visualization system that makes use of Geographic Information System (GIS) data to attest natural disasters such as storm surge. More importantly, they made use of Light Detection and Ranging (LiDAR) data collected and distributed by The National Oceanic and Atmospheric Administration (NOAA). LiDAR is a remote sensing technology which emits lasers and measures the time it takes for the sensor to detect the reflected light. The result is a point cloud that exhibits fine-grained height information of the scanned area.
DMIS have taken advantage of this technology to build accurate and interactive 3D maps that represent real life coastal areas. Maria Eugenia Presa Reyes used Unity 3D game engine to render the 3D models, provide physics for moving objects like cars and water, and alter appearances based on pre-calculated lighting effects.
DMIS is also in partnership with Miami-Dade County has created the Storm Surge Simulator, which combines historical data and modern day technology to demonstrate what a storm surge could mean more than 1.75 million people and their home.
Our goal is to enhance the learning experience of the effects of natural disasters.
~ Dr. Shu-Ching Chen
The post Virtual Reality Storm Surge Visualization System appeared first on School of Computing and Information Sciences.
Source: Activities – School of Computing and Information Sciences Click here to read more.